Analyze

Make informed property decisions with the data already in DNK

Make informed property decisions with the data already in DNK

Explore your data with ready-made charts and dashboards built on real estate expertise, or create your own to answer the questions that matter to you.

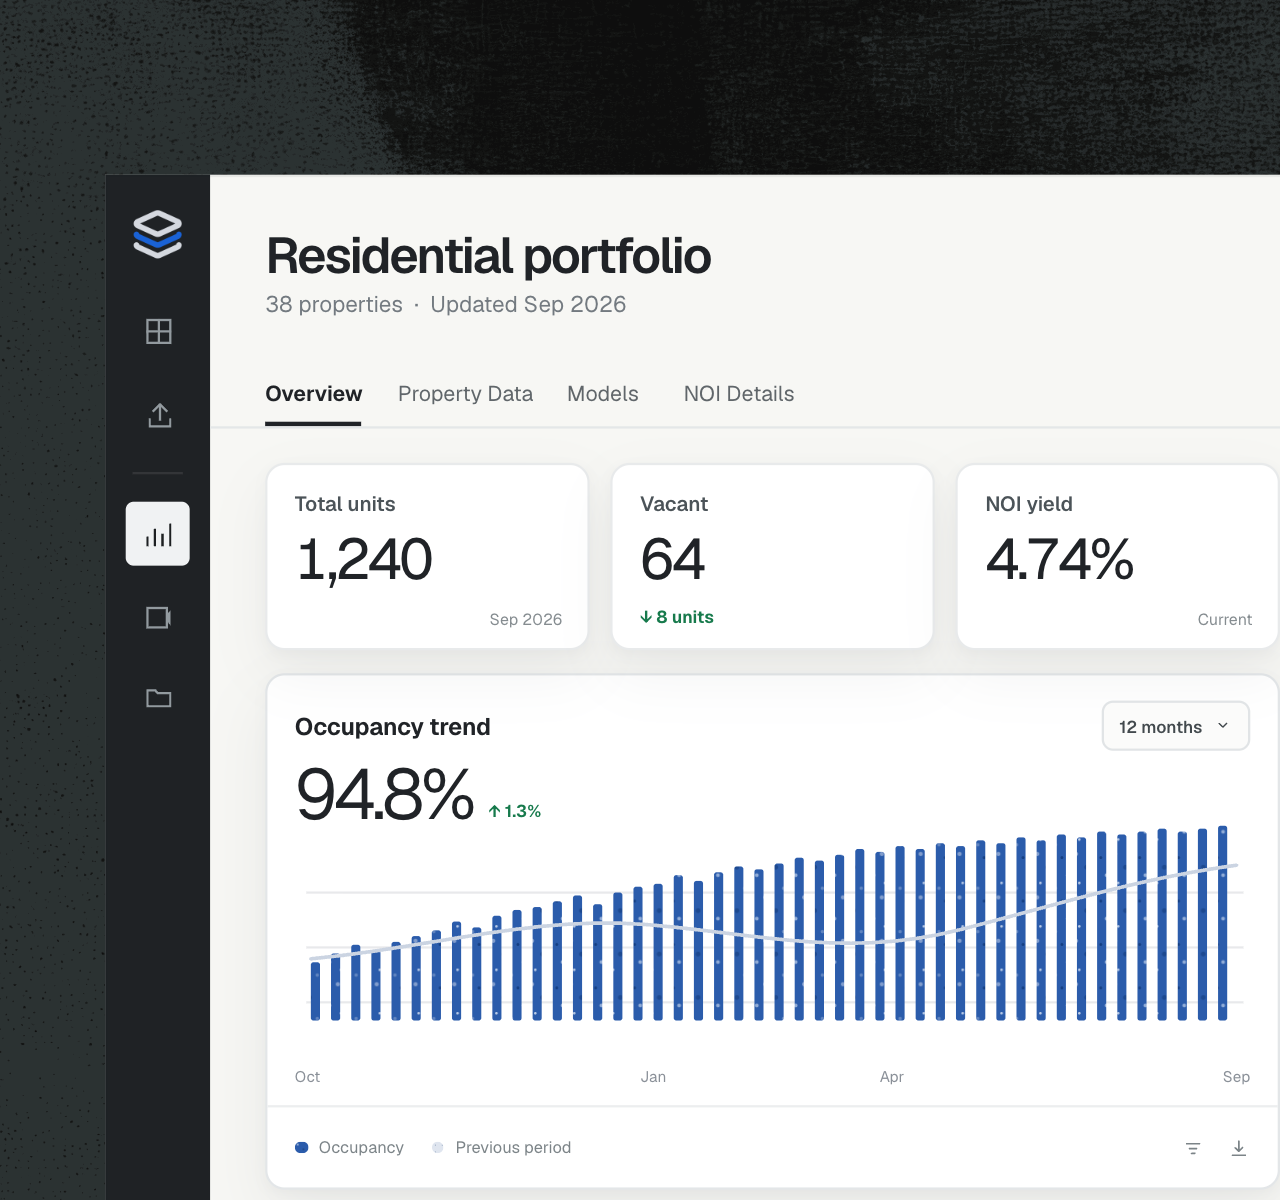
Explore your DNK data through charts built for Japanese real estate

Explore the data you’ve uploaded to DNK with charts and dashboards tailored to Japanese real estate, built on our industry expertise.

Export chart data to Excel for further analysis.

Download charts as PDFs for reports and presentations.

DNK residential portfolio dashboard with unit, vacancy, and NOI yield KPIs and an occupancy trend chart

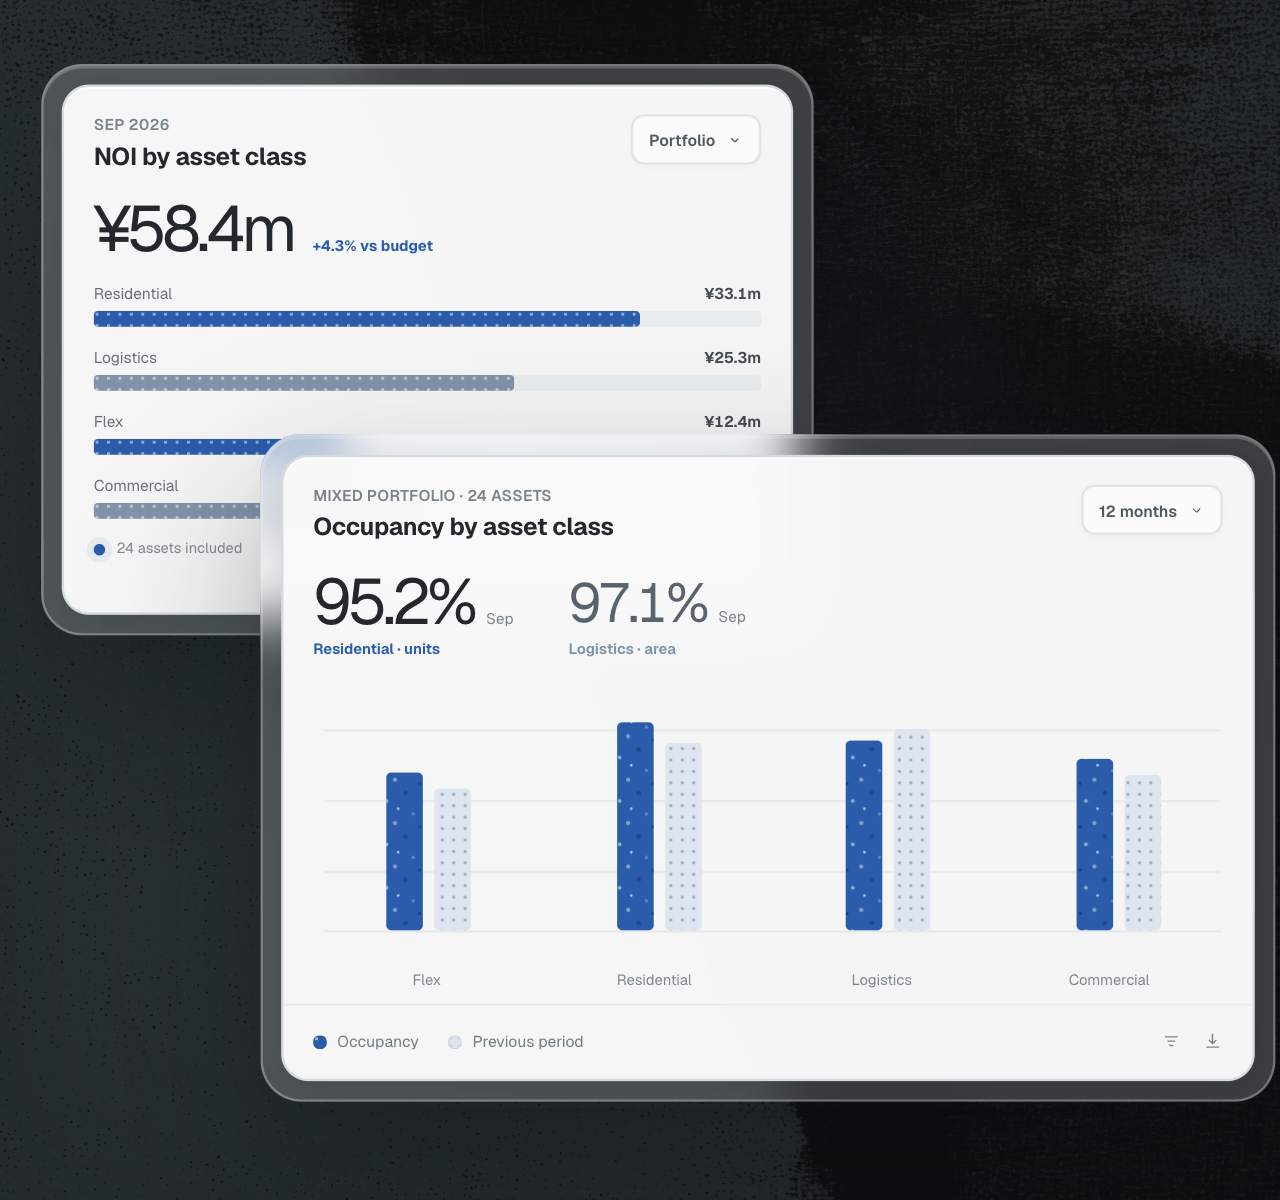
See across asset classes with analysis built for mixed portfolios

Understand portfolio and company performance across asset classes with mixed-asset charts included in DNK’s ready-made analysis, using the data already in the platform.

Access cross-asset-class analysis without developing the charts yourself.

Examine performance across a mixed portfolio and within each asset class.

DNK cross-asset analytics comparing NOI and occupancy across Flex, Residential, Logistics, and Commercial portfolios

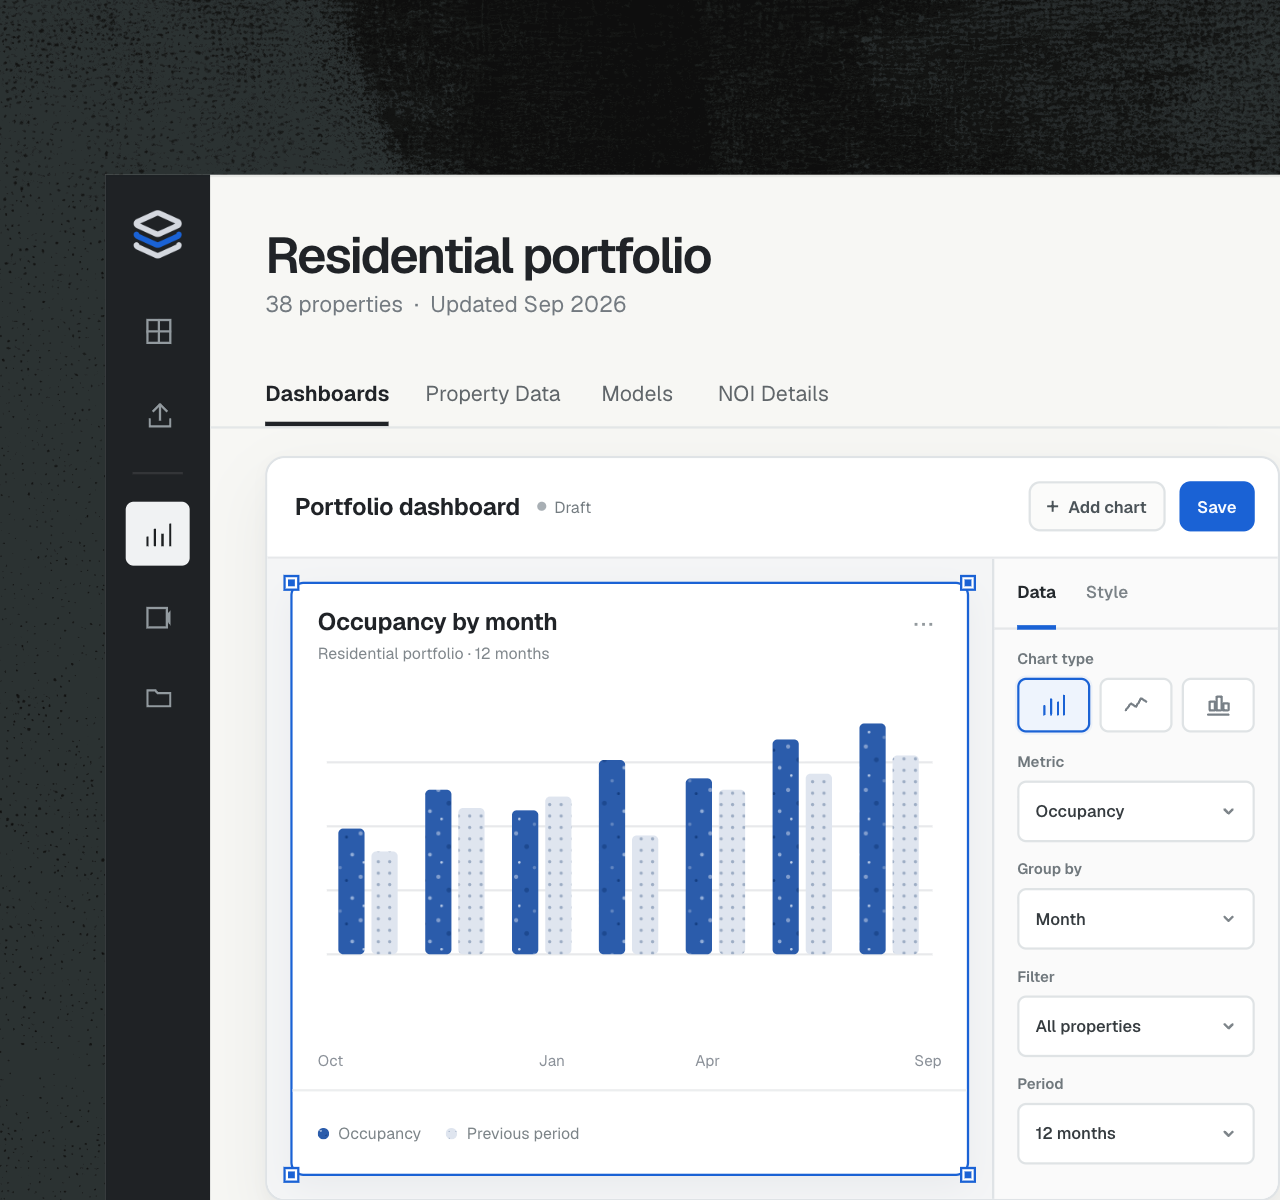
Build your own charts and dashboards to fit your work

Use DNK’s built-in BI tools to create and customize charts, then organize the views you return to regularly into your own dashboards.

Customize charts for your analysis and reporting needs.

Return to your saved dashboards within the same platform.

DNK custom dashboard builder with an occupancy chart selected and data controls open

See DNK in action with your own reports.